PCSO LOTTO NUMBERS FREQUENCY
Ultra Lotto - 30 draws
Image Chart
Image Chart
)
| Number | Times Drawn | Percentage (drawn/draws) |
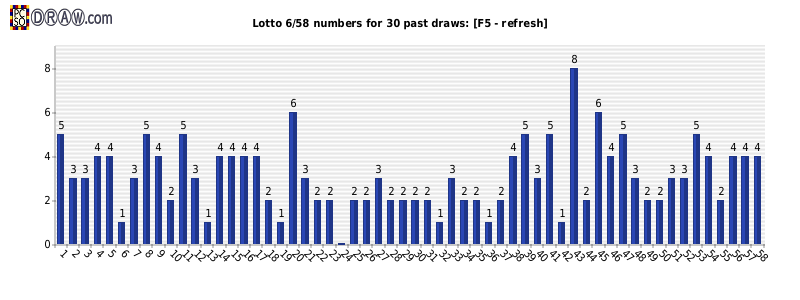
| 1 | 5 | 16.67% |
| 2 | 3 | 10% |
| 3 | 3 | 10% |
| 4 | 4 | 13.33% |
| 5 | 4 | 13.33% |
| 6 | 1 | 3.33% |
| 7 | 3 | 10% |
| 8 | 5 | 16.67% |
| 9 | 4 | 13.33% |
| 10 | 2 | 6.67% |
| 11 | 5 | 16.67% |
| 12 | 3 | 10% |
| 13 | 1 | 3.33% |
| 14 | 4 | 13.33% |
| 15 | 4 | 13.33% |
| 16 | 4 | 13.33% |
| 17 | 4 | 13.33% |
| 18 | 2 | 6.67% |
| 19 | 1 | 3.33% |
| 20 | 6 | 20% |
| 21 | 3 | 10% |
| 22 | 2 | 6.67% |
| 23 | 2 | 6.67% |
| 24 | 0% | |
| 25 | 2 | 6.67% |
| 26 | 2 | 6.67% |
| 27 | 3 | 10% |
| 28 | 2 | 6.67% |
| 29 | 2 | 6.67% |
| 30 | 2 | 6.67% |
| 31 | 2 | 6.67% |
| 32 | 1 | 3.33% |
| 33 | 3 | 10% |
| 34 | 2 | 6.67% |
| 35 | 2 | 6.67% |
| 36 | 1 | 3.33% |
| 37 | 2 | 6.67% |
| 38 | 4 | 13.33% |
| 39 | 5 | 16.67% |
| 40 | 3 | 10% |
| 41 | 5 | 16.67% |
| 42 | 1 | 3.33% |
| 43 | 8 | 26.67% |
| 44 | 2 | 6.67% |
| 45 | 6 | 20% |
| 46 | 4 | 13.33% |
| 47 | 5 | 16.67% |
| 48 | 3 | 10% |
| 49 | 2 | 6.67% |
| 50 | 2 | 6.67% |
| 51 | 3 | 10% |
| 52 | 3 | 10% |
| 53 | 5 | 16.67% |
| 54 | 4 | 13.33% |
| 55 | 2 | 6.67% |
| 56 | 4 | 13.33% |
| 57 | 4 | 13.33% |
| 58 | 4 | 13.33% |
PCSO frequency statistics - How to use
This very handy statistic can answer you few different questions about your favourite lotto game:- How often all the numbers are drawn due in selected time period??
- Which Lotto or Swertres numbers are hot right now?
- Which of 6-Digit numbers drawn are cold right now?
- All games are provided.
- You can choose different time spans to analyse.
Use this statistics to determine what numbers "like" to be drawn together or simply which of them are drawn frequently and which not at all. We call them Lotto hot and cold numbers. You can see frequency data not only in the table with numbers, but on the special chart we generate for you. The most common numbers have highest columns on the chart. This type of visible lottery data is useful for predictions.
Below you see last generated chart by one of the players with this tool.